Networked Ultrasonic Snow fall / Snow Depth / Water Height Sensor
Copyright 2005, Chris Nafis, Vischer Ferry, NY, USA
Background
Snow
Living in Upstate New York, USA we get a
reasonable
amount of snow every year.
In the fall of 2003 we put a
1-Wire Weather Station
together. One of the local TV stations (
CBS6Albany)
has put together a web interface for local weather spotters to report
weather information (
WeatherNet6).
In the winter this includes snowfall.
What surprised me was the inconsistency of how people / agencies measure snowfall.
The local TV station uses a snow board which they clear after every
inch of snow. Other people say you have to clear the board at least once
a day but no more than four times a day.
Mother Nature also makes measuring snowfall interesting because of drifting, compresssion,
and melting.
Here are some snow measurement references I
found on the web:
I was interested in how much snow was on the ground and at what rate it was
falling and melting. I thought developing a sensor that measured this
continuously would be of interest. If the sensor could be made inexpensively,
then the power of the Internet could be used to collect a large number of samples
over large areas.
The popular weather data collections sites (
Weather Underground,
Citizen Weather Observer Program)
currently don't provide
fields for snowfall, but this is changing. I noticed that
WeatherMatrix
has started a beta system for reporting snowfall.
The National Climatic Data Center
U.S. Snow Monitoring web site now shows recent snowfall and snowdepth maps.
The National Operational Hydrologic Remote Sensing Center provides
Interactive Snow Information
Flooding
The 2005 hurricane Katrina showed the need for a robust network of flood sensors.
Officials are interested in lake and river levels after severe weather.
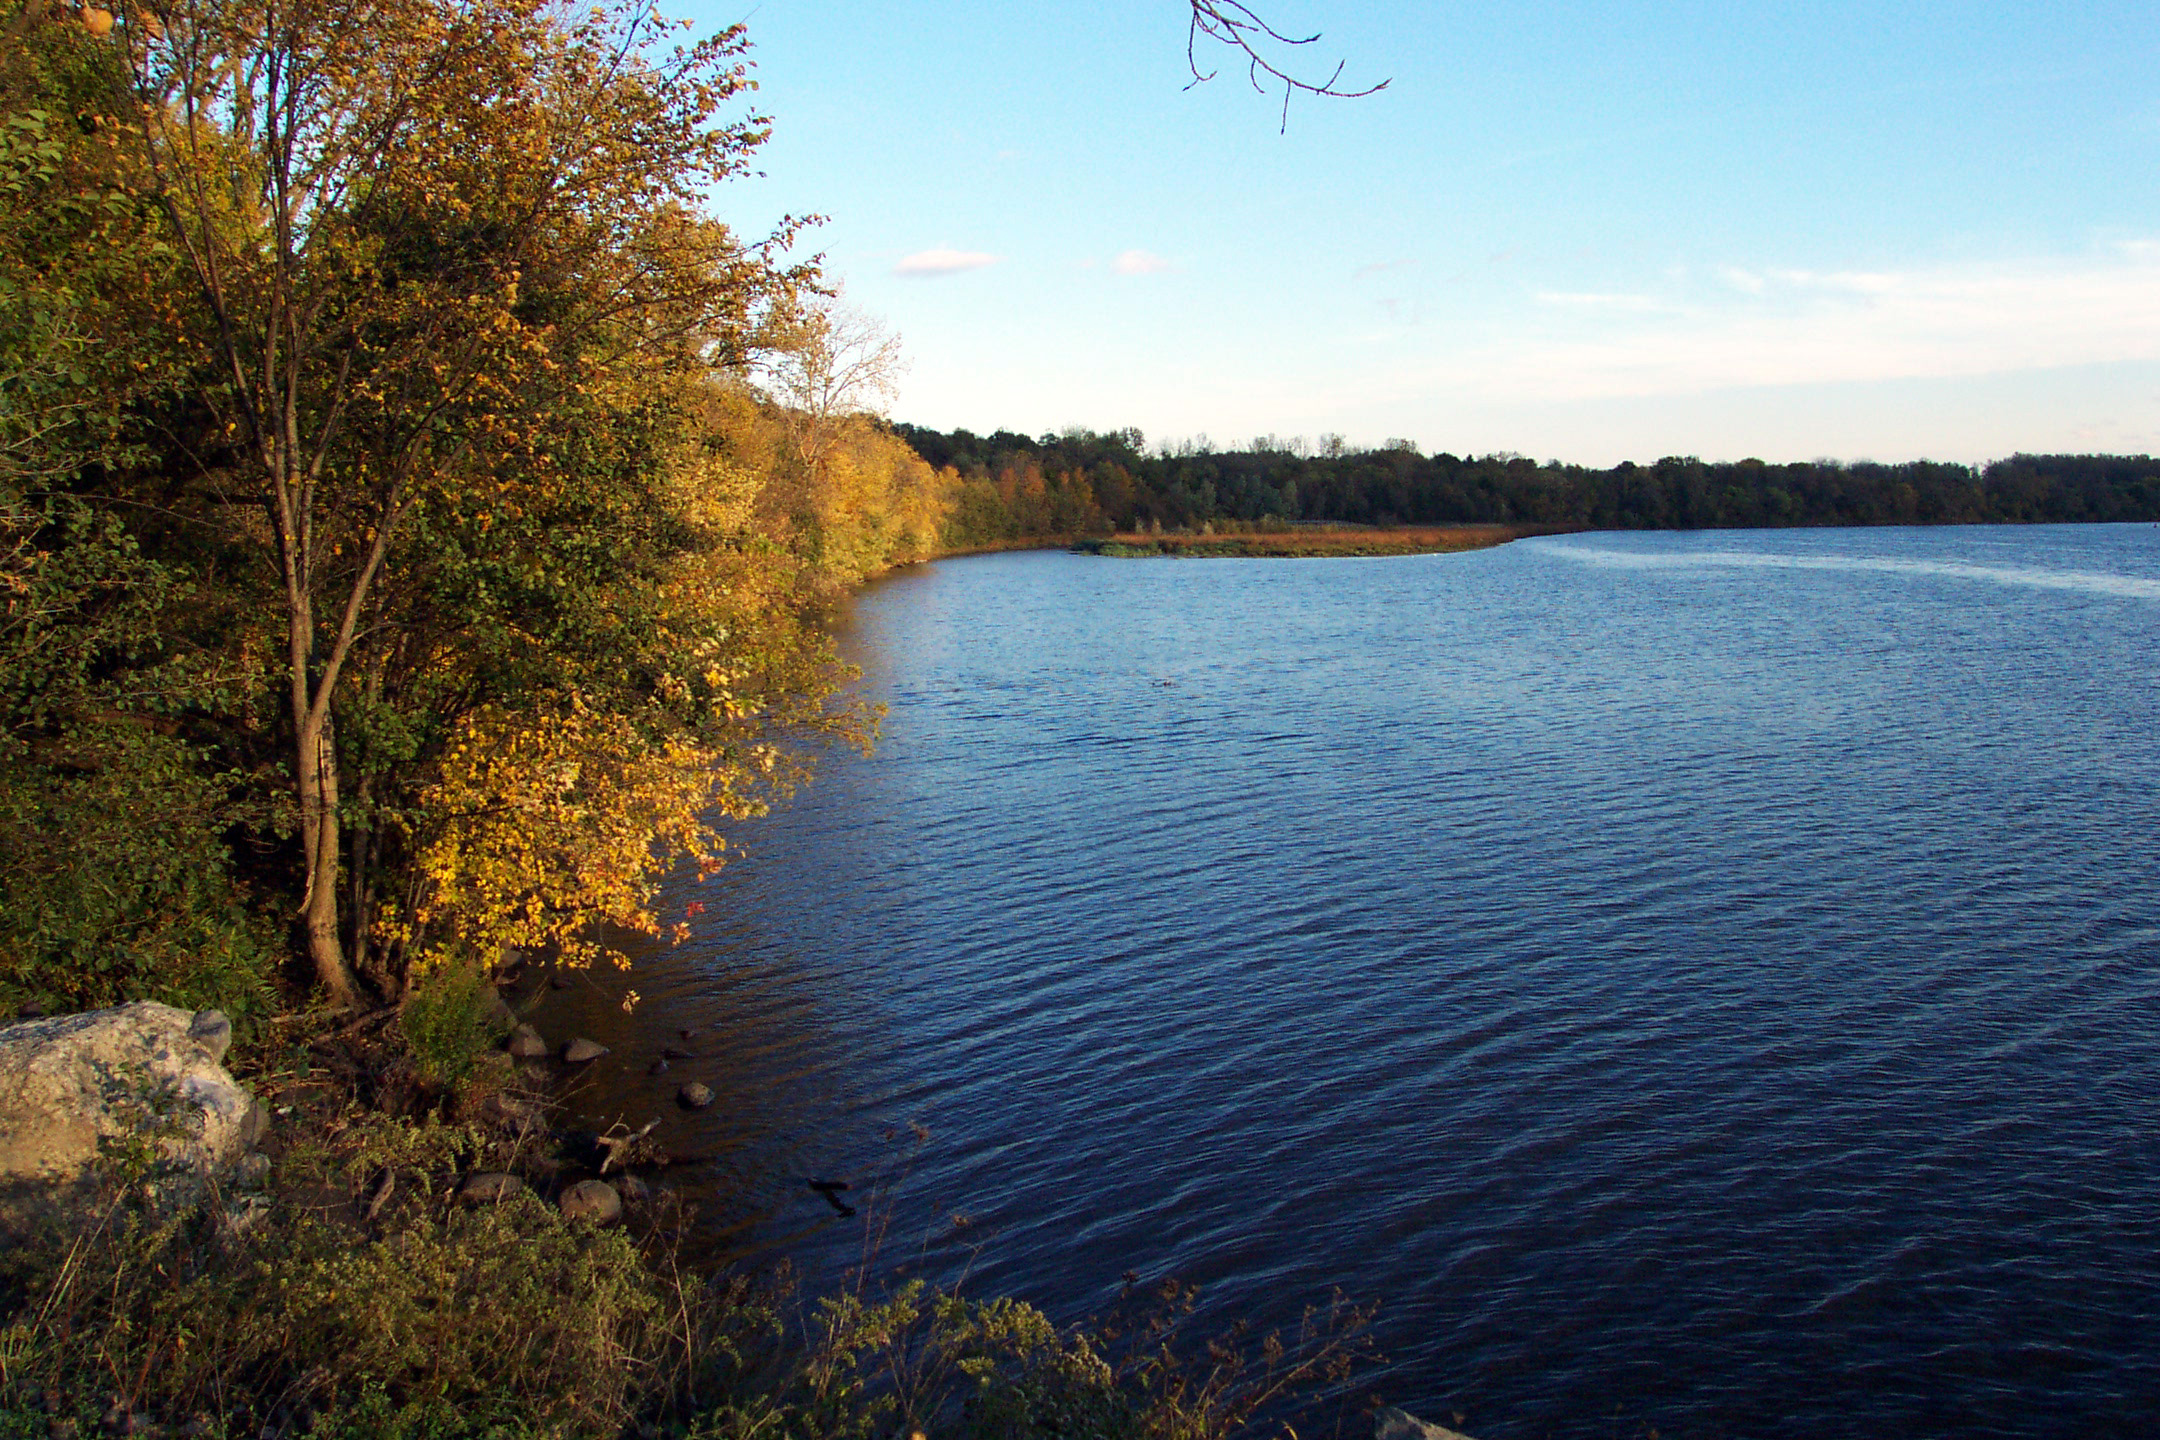
The local Mohawk River occasionally floods in the early spring when the ice gets jammed.
John Gara from the Geology Department at Union College
describes the
HISTORICAL RECORD OF FLOODING ON MOHAWK RIVER, NEW YORK.
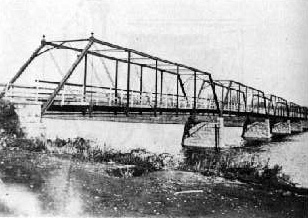
In 1900 a 790' toll bridge was built in Vischer Ferry. It was washed
away in a 1902 ice jam flood.
Approach

This sensor is designed to measure the height of water or the depth of snow
using an inexpensive non-contact ultrasonic sensor. The sensor connects to a ethernet connection
and posts it's data to the Internet. The sensor is powered over the spare ethernet pairs
and is connected with standard CAT-5 cable. It has been tested at distances up to 200'.
The speed of sound changes with temperature. This sensor measures the temperature to
compensate the distance calculation.
The ultrasonic sensor used can measure distances up to 3 yards and has a fan angle of
around 15 degrees at 5'. Distances are measured by emitting a 40KHz burst and then
listening for the return echo. This is above the frequency that humans can hear.
Sound travels roughly 1130 feet/second. The time has to be
measured very accurately.
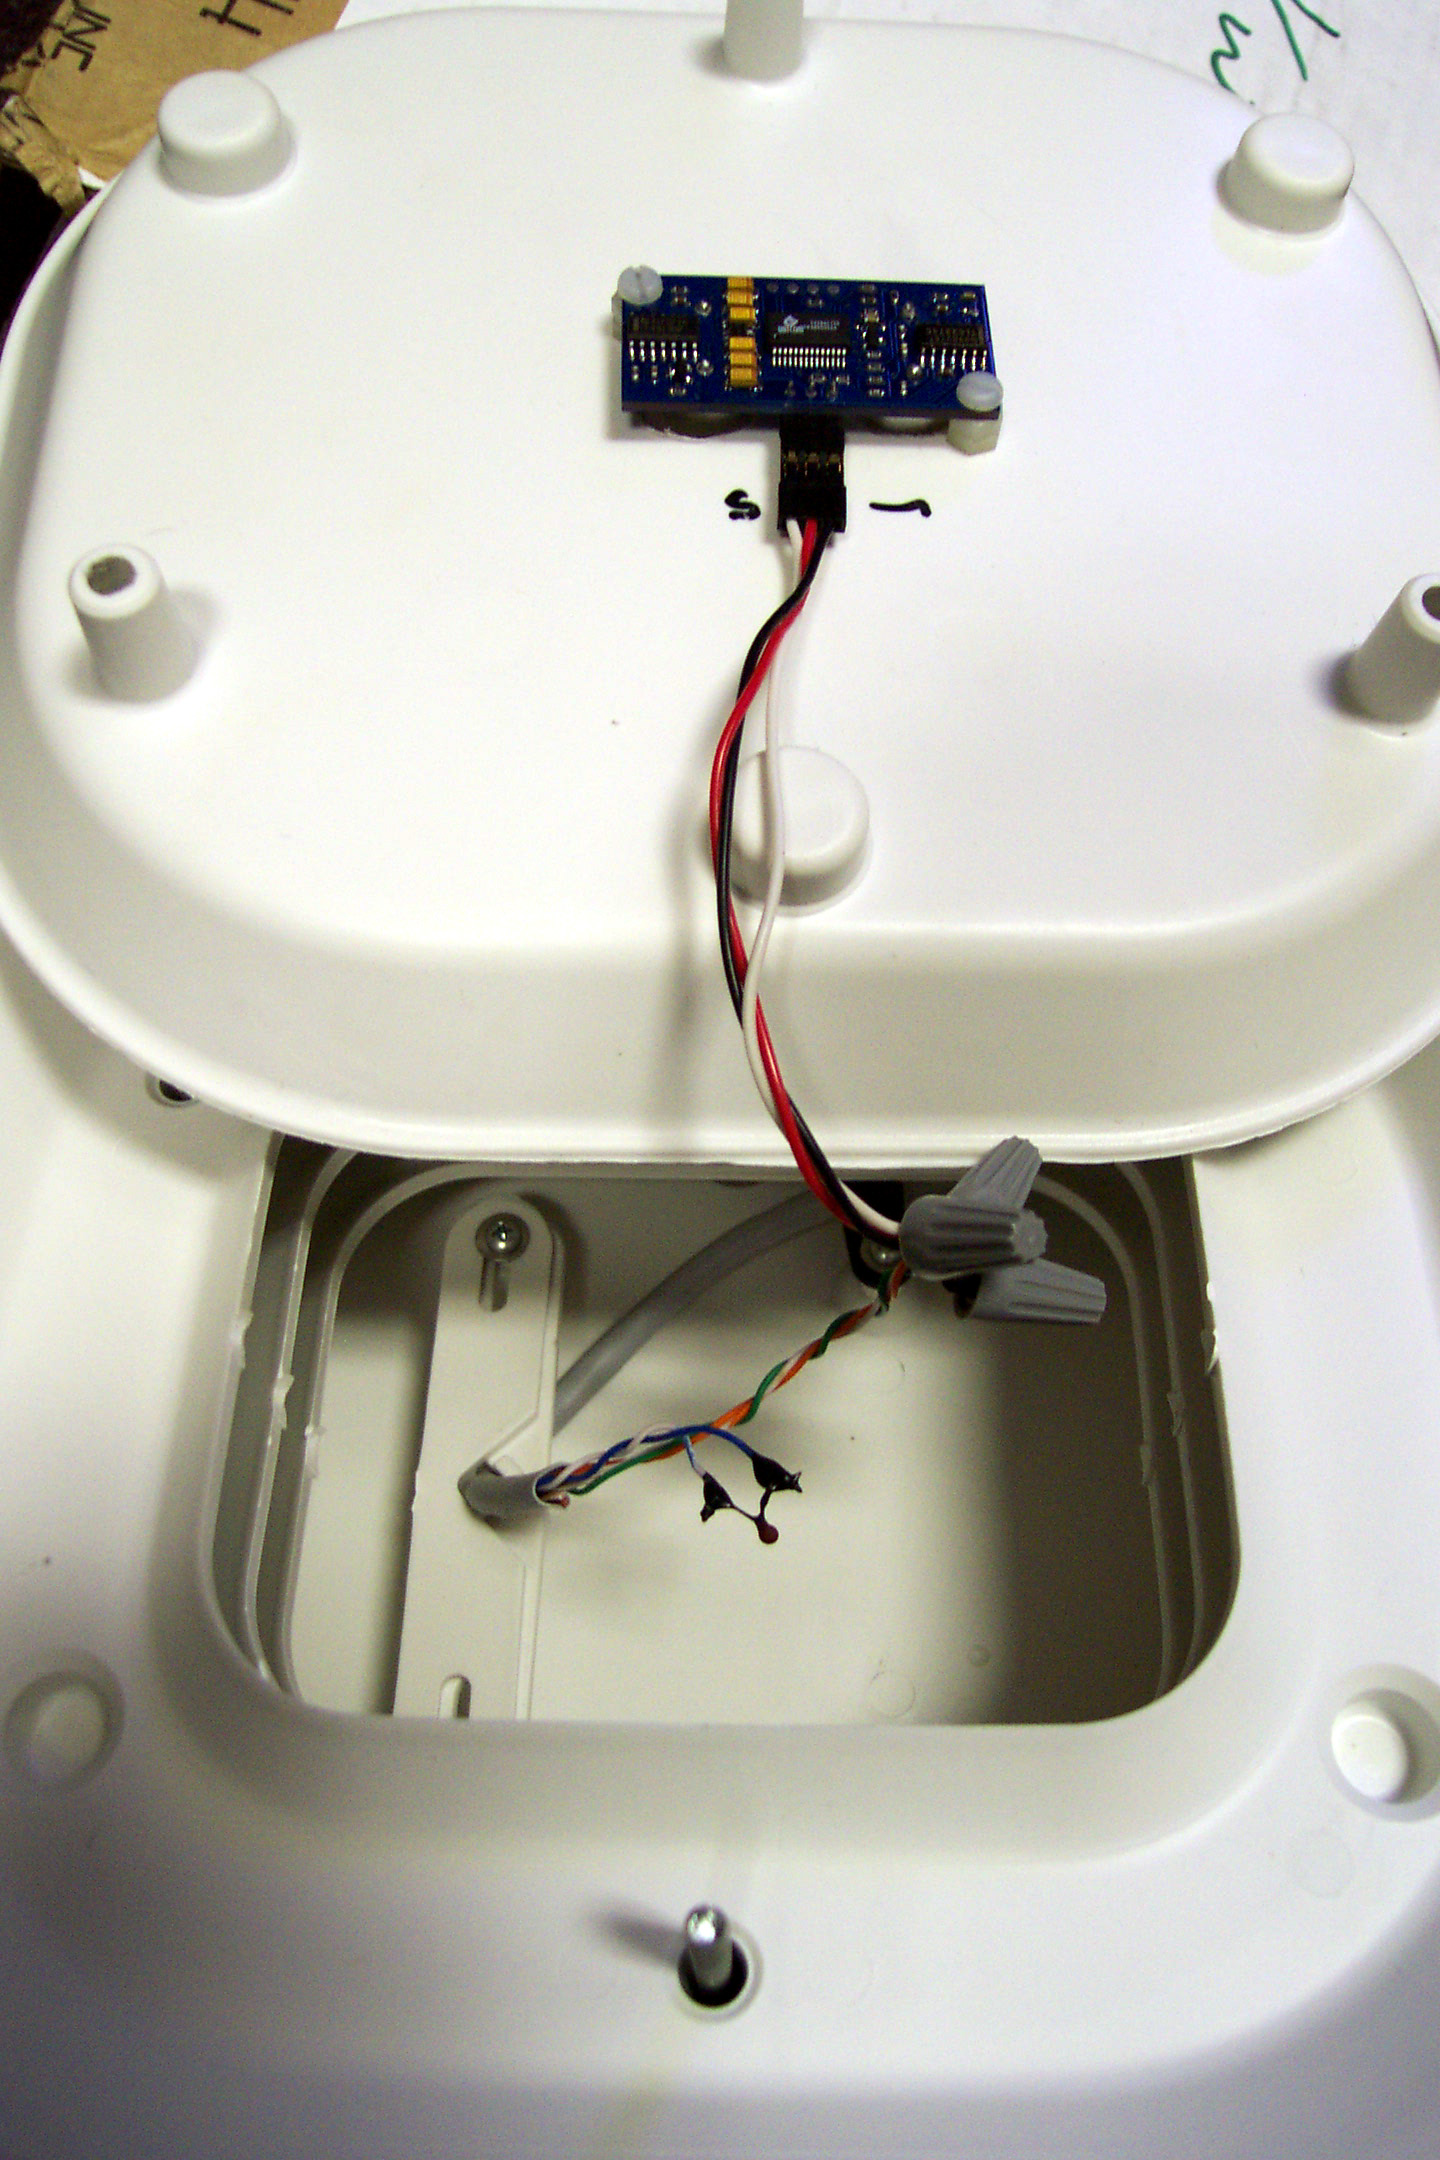
This prototype is built around the
Imaginetools Prototype board
which simplifies development. A "production" version of the sensor could be made much
smaller and be enclosed directly in the radiation shield.
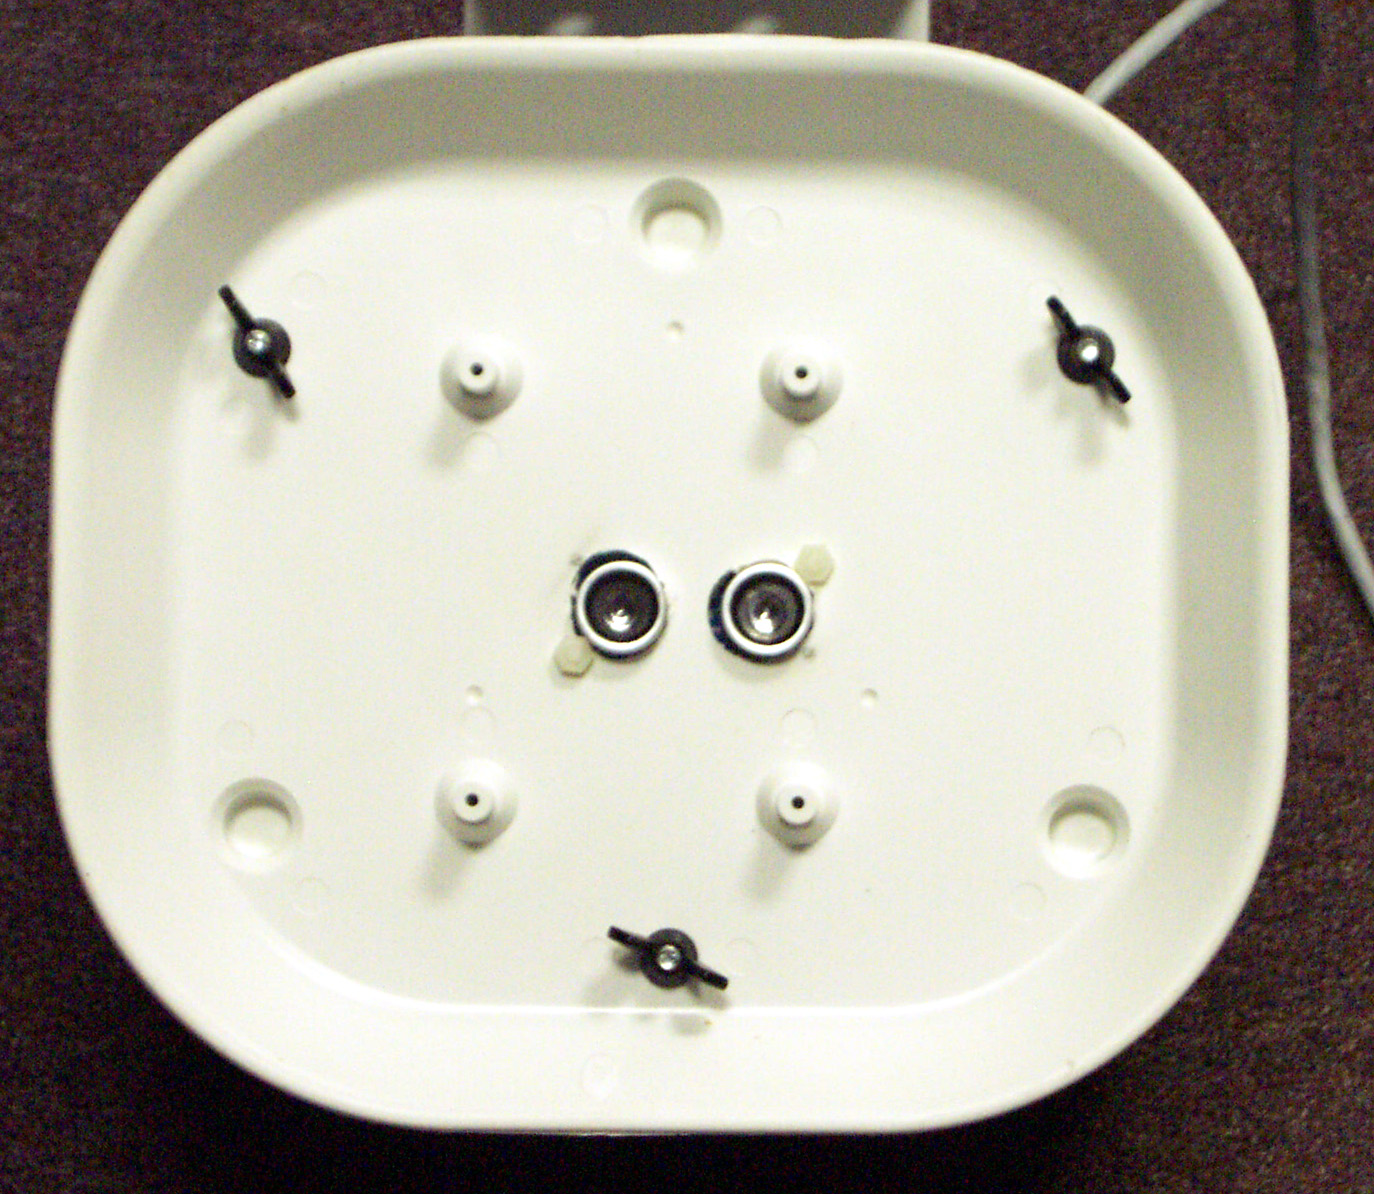
Assembly
Installing capacitor and Thermistor
The Ethernet Starter kit comes with a 10K Thermistor and a 0.1 uF capacitor.
The capacitor is soldered at the C1 location on the protoboard. The blue and blue/white
wires from a 6' CAT-5 wire are soldered to R1 on the protoboard. The thermistor
is soldered to the other end of the CAT-5 blue and blue/white wires. Alternatively, you
can solder two small wires to R1 and then use wire-nuts to attach them to the CAT-5
wires (This makes it easier to remove the prototype board in the field).
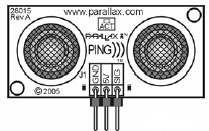
Installing PING sensor
Using one of the 2x20 0.1 headers included in the starter kit and the same
6' CAT-5 wire from above, solder the orange
wire to the +5VDC (J15 VCC). Solder the orange/white wire to GND (J15 GND).
Solder the green wire to an R/W IO pin (J15 PC1).
At the other end of the CAT-5 wire, connect the the orange/white wire to GND (J1 GND).
Connect the orange wire to +5VDC (J1 5V) and the green wire to J1 SIG.
A servo extension cable can be used if you don not want to solder directly to the PING
pins.
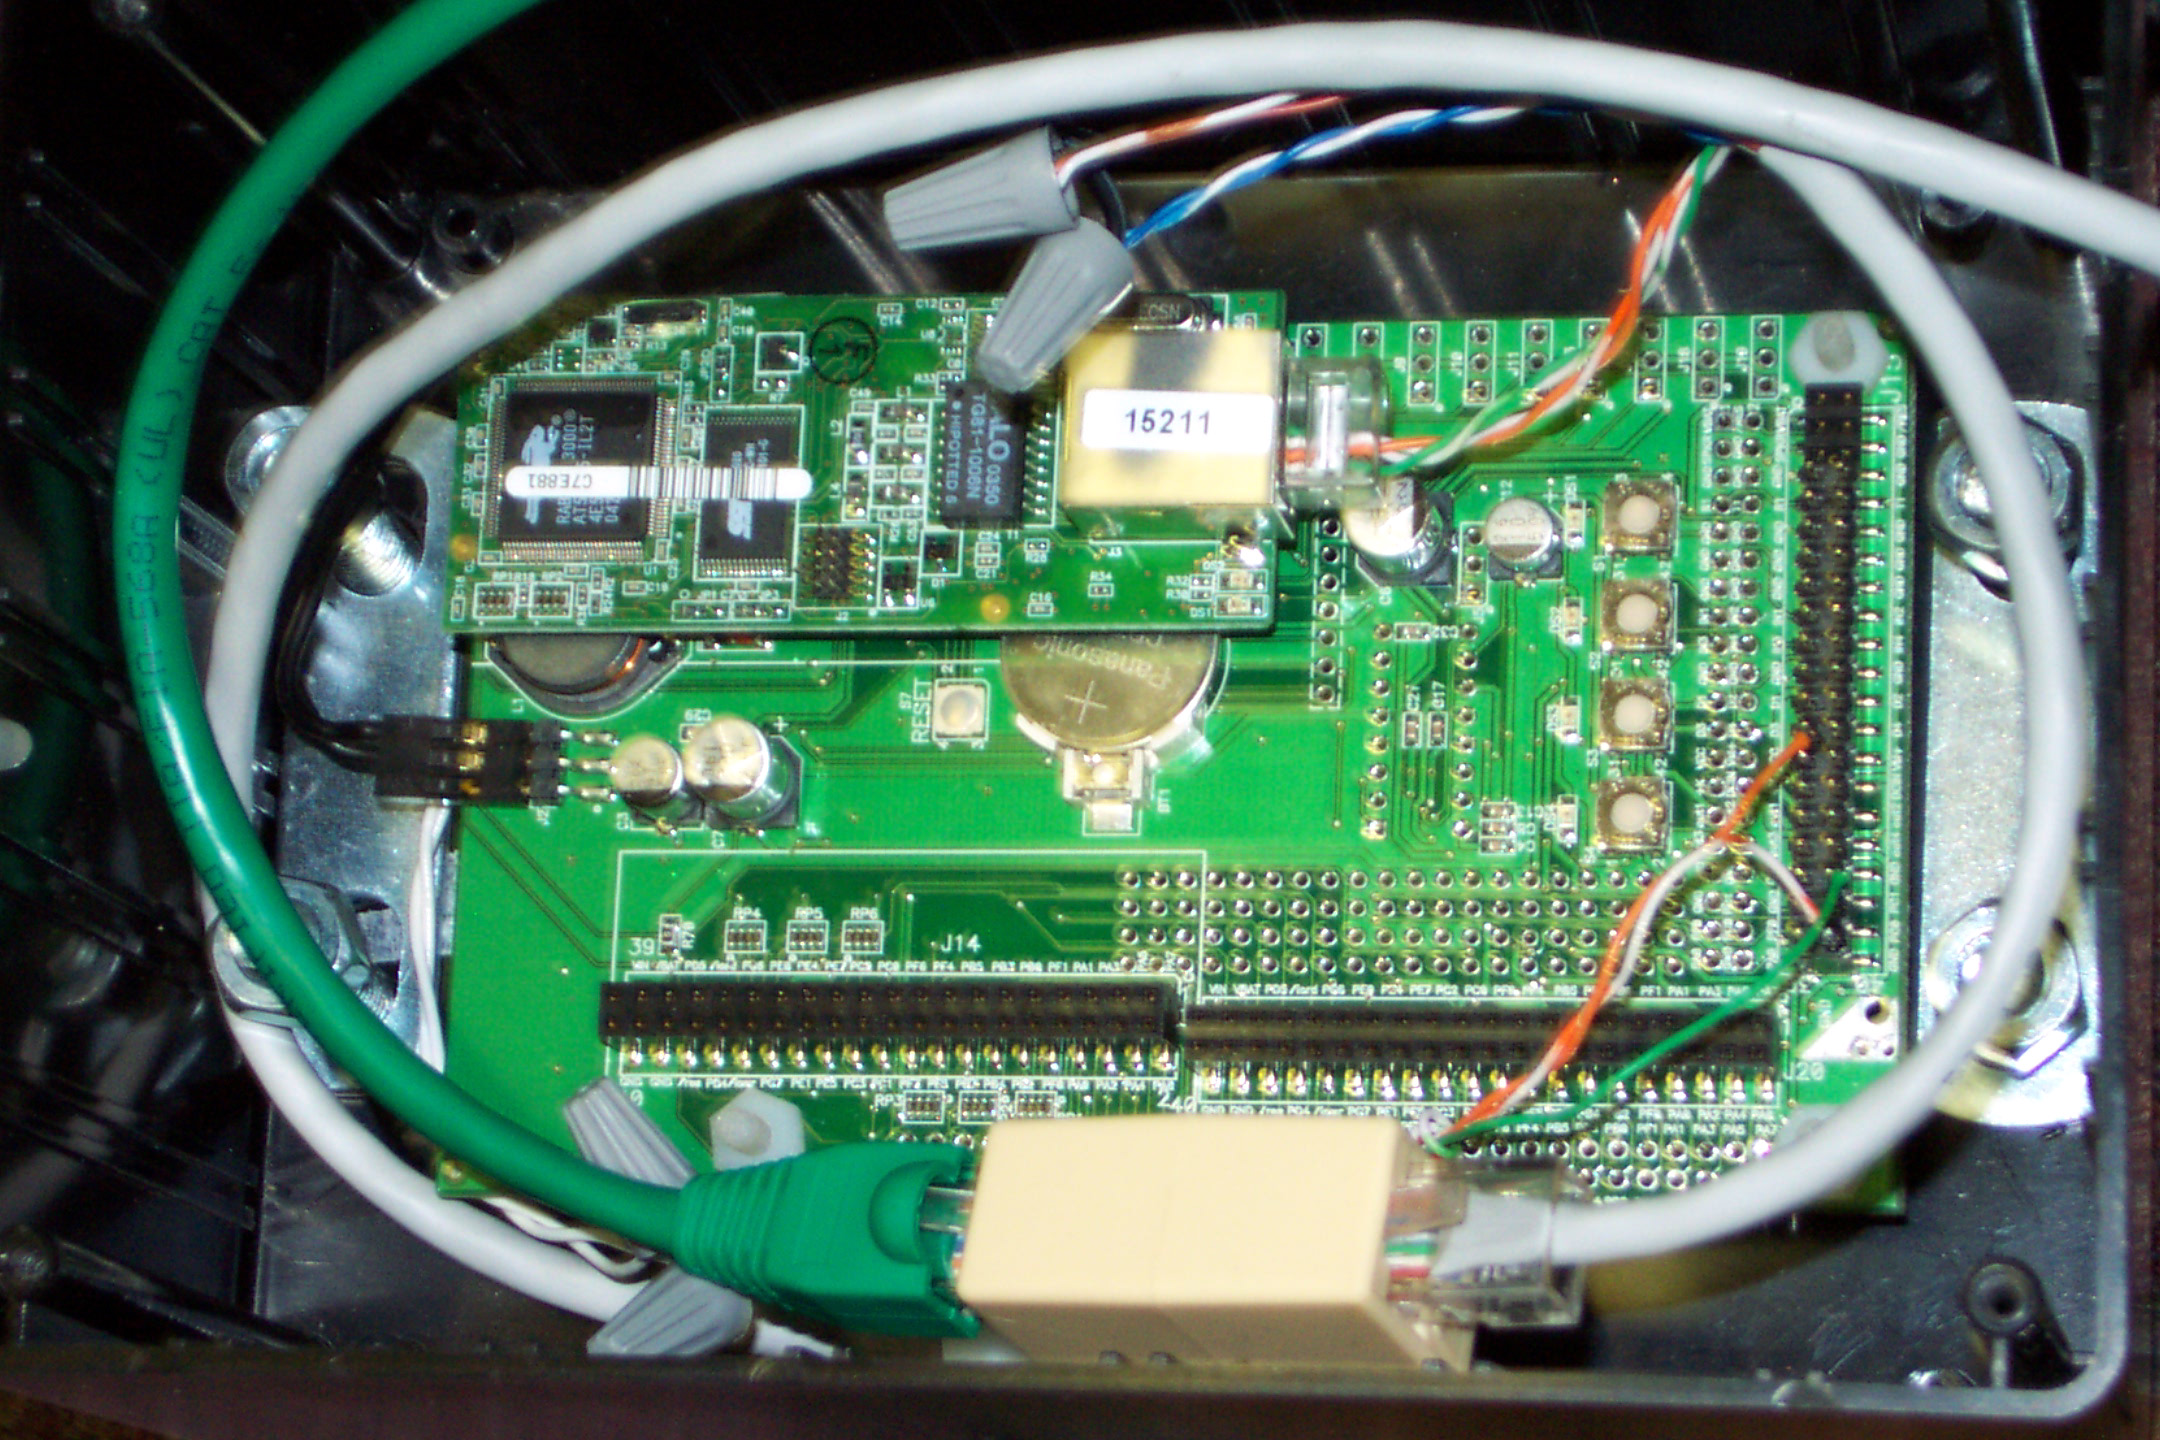
Power over Ethernet
Instead of running a separate wires from the 120VAC/12VDC adapter out to the
sensor, we can use the "spare" pairs in the Ethernet cable (typically called
Power over Ethernet or POE).
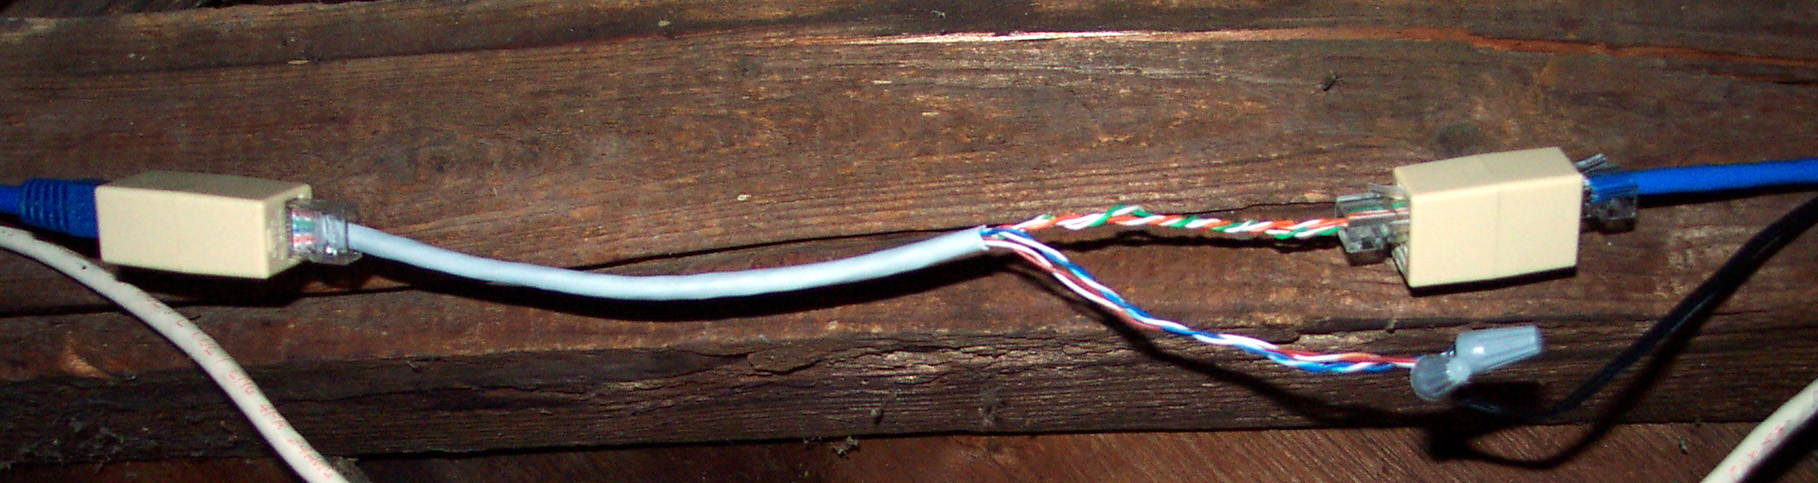
The RJ45 pins 4&5 are used for the +DC, and the 7&8 pins for the ground.
Ethernet uses Pins 1,2,3, and 6. The easiest way to do this is to use CAT-5 couplers and
to make up some short cables using CAT-5 crimp on connectors. The AC adapter that comes
with the starter kit gets it's DC wires cut several inches before the protoboard connector.
Wire nuts are used to attach the "wall wart" wires to the blue and orange pairs. The power is now
"injected" on the CAT-5 wire.
Out in the sensor, the power needs to be removed before the CAT-5 cable is connected
to the Rabbit Processor board. Again we use a coupler and crimp on RJ45 connectors.
The blue and orange pairs are connected to the flat connector previously cut from the
AC adapter.
Controller Hardware
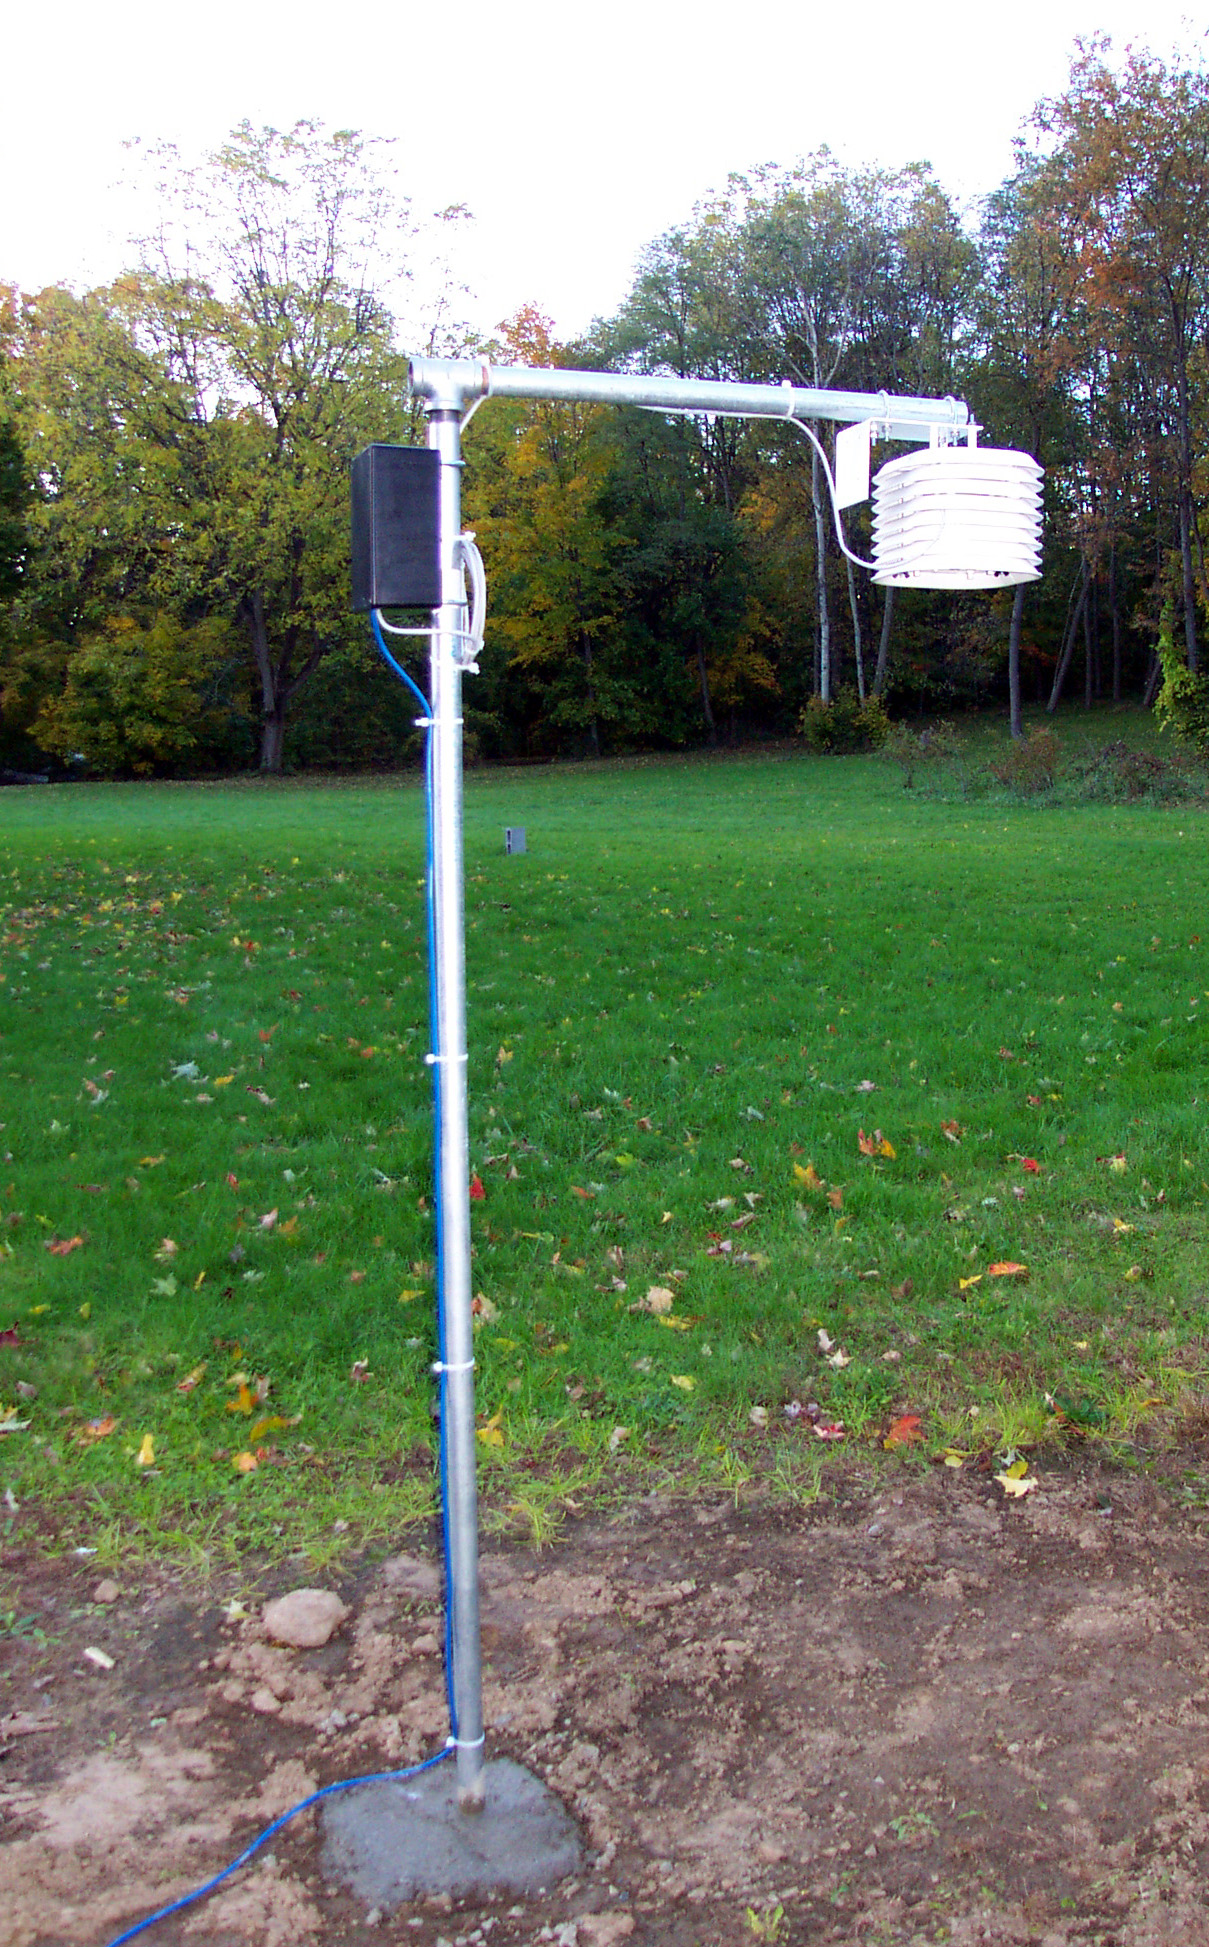
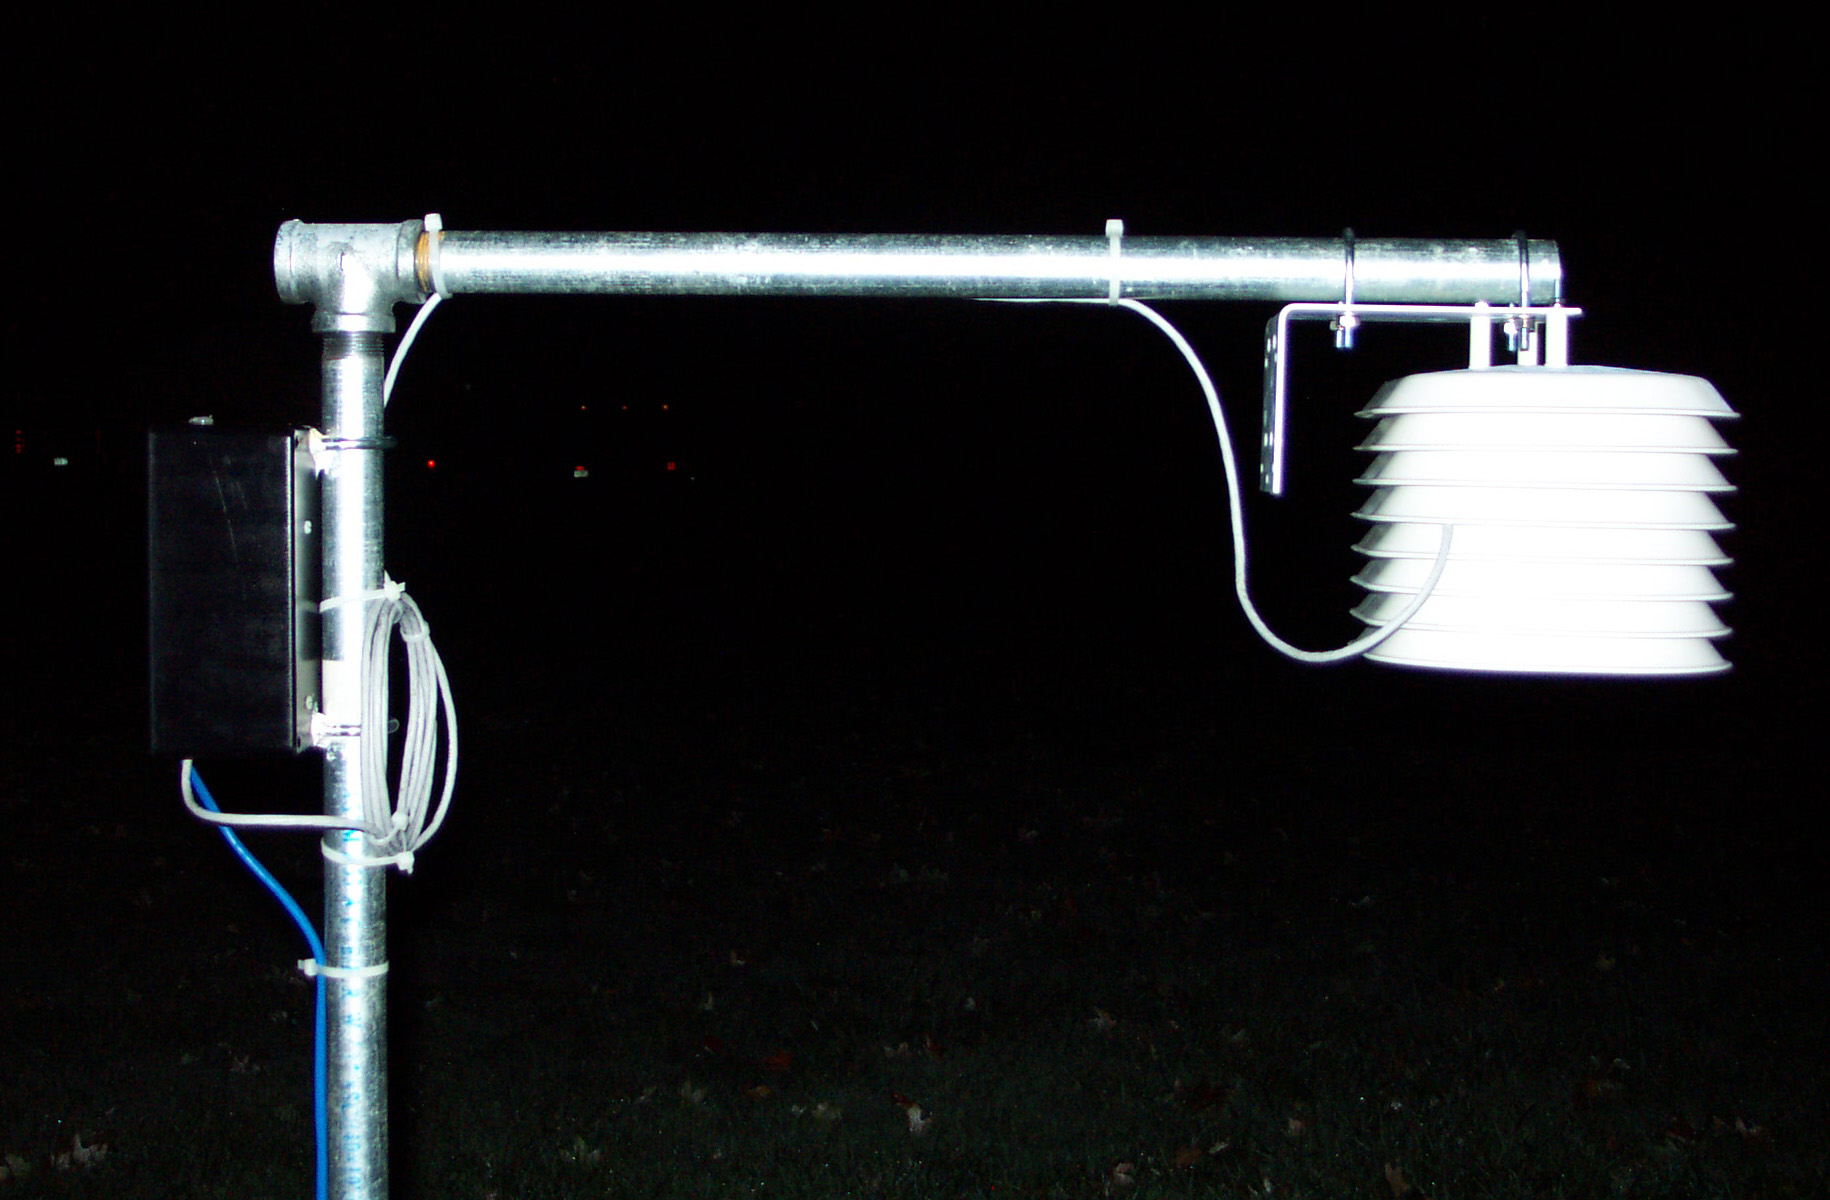
Sensor Installation
The sensor has to be mounted high enough that it does not interfere with the falling
snow (> 5'?). The arm that holds the sensor must be long enough that the ultrasonic sensor
does not see the mounting pole. Cement was poured around the base of the pole to help
minimize movement.
-
10 foot, 1 inch galvanized pipe
-
1 inch galvanized pipe 90 degree elbow
-
two U-bolts for 1" pipe
-
Caulk
Software
The
depthsensor.c
file demonstrates the measurement and
uploading processes. Three co-states are used. One samples the temperature by reading
the R/C network thermistor. The second uses a single I/O pin to activate the ultrasonic
sensor and to measure the length of the duration pulse.
The last state posts the
sensor data to a web page on the Internet.
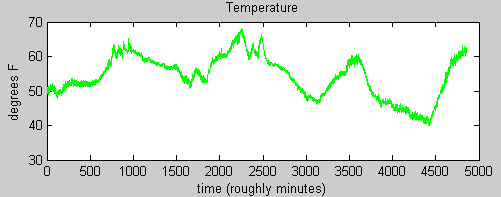
Speed-of-Sound and Temperature Measurement
The speed of sound is approximated by:
speedofsound (M/sec) = 331.4 + 0.6 * (Tk - 273.0);
where Tk is the Temperature in Kelvin.
The temperature is measured with a capacitor and thermistor.
See the
Thermostat Project
for more details.
	 PW = PW * 1.0e6;
         R = PW / ( 0.40 * Cap );
         A = 1/298.0 - ((1/Bth) * log(Rth));
         Tk = 1 / (A + ((1/Bth)*log(R)));

         where:

         Rth = 10000.0
         Bth = 3964.0
         Cap = 0.100
Ultrasonic Pulses
The
PING Documentation
says that you have to create a 5uSec pulse to initiate a measurement.
You then have a 750uSec hold-off period
to switch the I/O pin from writing to reading. The maximum expected pulse is 18.5mSec.
The HBpulseListen1 command is used to measure the pulse width. You can see the
interaction on the oscilliscope screen below:

Web Posting
A simple PERL cgi-bin script is set up on a web server. The rabbit requests a URL
that has the sensor measurements coded as parameters
(e.g.
http://www.howmuchsnow.com/cgi-bin/postrange.pl?sensor=VF1&temp=70&range=66.123).
The script stores the sensor data in a file.
Internet Data
The
Raw sensor depth data is
logged to a web server. The file names start with the sensor ID and are followed by the
UTC date. The timestamps in the file are in UTC.

This allows
PHP libraries like
JpGraph to be used to
graph the data each time a web page is requested.
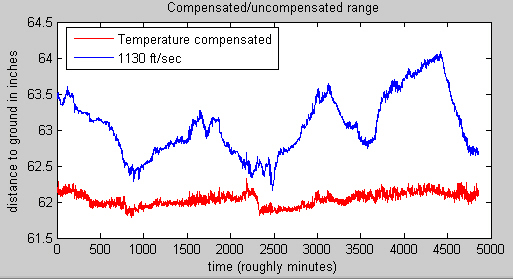
Accuracy
It hasn't snowed yet... but the following graphs show the sensor drift
over several days.
It shows a mean distance of 62.04 inches with the maximum 0.29 inches above the
mean and the minimum of 0.25 inches below the mean. It also shows the importance
of adjusting the speed of sound for the temperature.
So the repeatabililty is not better than +/- 0.3 inch.
Other Projects
Check out some of my other projects: